
This information comes from websites, online purchases, customer feedback, social media platforms, and marketing campaigns. However, collecting data is not enough. Businesses must analyze their data to gain valuable insights and find ways to improve their overall performance. Data analytics helps them turn raw information into meaningful results and make better decisions. Python is one of the most popular programming languages used for analyzing data because it is beginner-friendly, flexible, and powerful.
What Is Data Analytics with Python?
Data analytics with Python is the process of collecting, organizing, cleaning, and examining data using the Python programming language. It helps professionals identify patterns, understand customer preferences, and discover useful information from large datasets.
For example, an online shopping business can use Python to study which products customers purchase most often. By analyzing this information, the business can understand customer interests, manage stock effectively, and plan better marketing campaigns. In the same way, educational institutions can analyze student performance, while healthcare organizations can study information to identify important trends.
Why Is Python Important for Data Analytics?
Python has become a preferred choice for data analytics because its syntax is relatively simple and easy to understand. Beginners can start with basic programming concepts and gradually learn advanced data analysis techniques.
Another advantage is its extensive collection of libraries. These libraries provide ready-made tools that reduce the amount of code required to complete different tasks. Python also supports automation, which helps professionals perform repetitive data-related activities more efficiently.
Python can work with different types of data, including spreadsheets, CSV files, databases, and information collected from websites. This flexibility makes it useful across many industries.
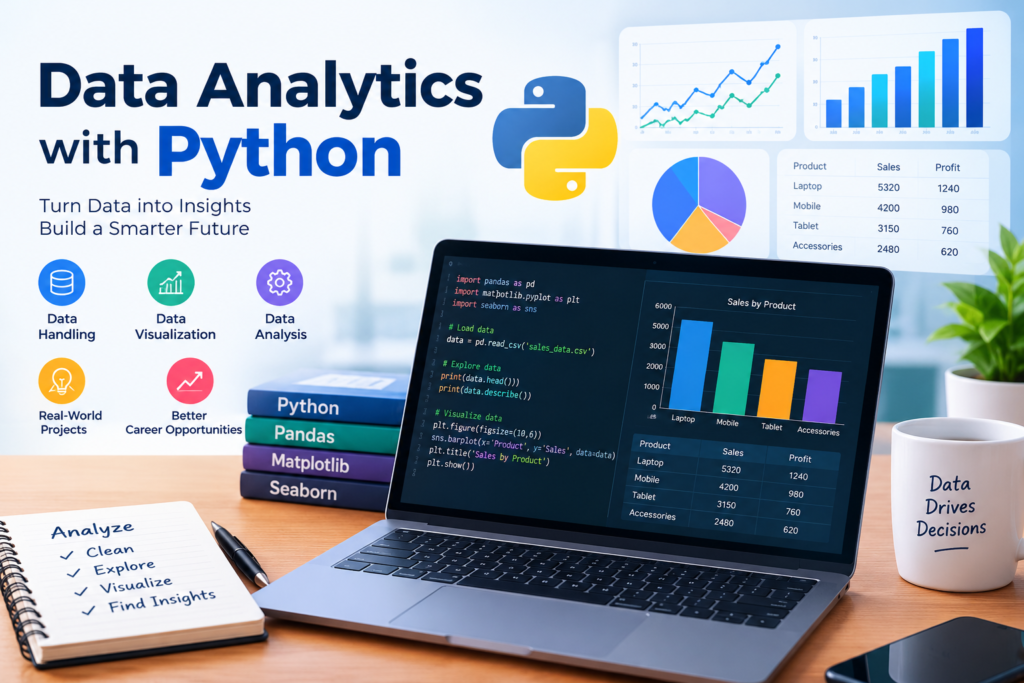
Important Python Libraries for Data Analytics
Learning a few essential Python libraries can help beginners build a strong foundation in data analytics.
1. Pandas
Pandas is used to organize, clean, filter, and analyze structured data. It allows users to work with tables similar to spreadsheets. For example, a marketing analyst can use Pandas to compare monthly website traffic and identify changes in customer engagement.
2. NumPy
NumPy supports numerical calculations and mathematical operations. It is useful when working with large collections of numbers and performing calculations efficiently.
3. Matplotlib
Matplotlib helps users create charts and graphs from data. These visual representations make it easier to understand changes, compare results, and communicate findings to others.
4. Seaborn
Seaborn is a visualization library that helps create informative statistical charts. It can be useful for exploring relationships between different variables and presenting analytical results clearly.
Steps Involved in Data Analytics with Python
Data analysis usually follows a series of steps to produce meaningful results.
First, data is collected from suitable sources, such as spreadsheets, databases, or business applications. Next, the data is cleaned by correcting errors, handling missing values, and removing unnecessary information.
After cleaning, Python libraries are used to explore the dataset and perform calculations. Analysts then identify patterns, compare values, and examine trends. Charts and graphs can help present the results in a simple format.
Finally, the findings are interpreted and shared through reports or dashboards.
Career Opportunities in Data Analytics
Learning data analytics with Python can help learners explore different career paths. Companies across industries need professionals who can understand information and explain what it reveals.
Some related job roles include data analyst, business analyst, reporting analyst, marketing analyst, and junior data scientist. The skills required vary depending on the position, but knowledge of spreadsheets, SQL, statistics, Python, and data visualization can be useful.
Beginners can improve their practical knowledge by working on projects such as sales analysis, customer behavior analysis, student performance reports, and website traffic analysis. These projects also help demonstrate their abilities when applying for entry-level positions.
How Beginners Can Start Learning
If you are new to programming, begin by understanding Python basics, including variables, data types, lists, loops, and functions. Then move on to Pandas and NumPy to learn how to work with datasets.
Practice using sample data and gradually create simple charts with Matplotlib or Seaborn. Try solving real-world problems instead of focusing only on theory. Regular practice will help you understand how data analytics works in practical situations.
Conclusion
Data analytics with Python combines programming, problem-solving, and business understanding to turn raw information into useful insights. Its beginner-friendly features and powerful libraries make it a practical choice for people who want to develop analytical skills. By learning the fundamentals and completing hands-on projects, beginners can build a solid foundation and prepare for opportunities in the growing data analytics field.